In the past few years, makers of digital oscilloscopes have realized the value of adding a third dimension to their displays by controlling the color and intensity of the swept display plot. Not only can 'x' and 'y' coordinate values be shown, but also signal density, i.e. qualitative statistical properties of the signal can be represented in real time. LeCroy and Tektronix are major manufacturers of digital oscilloscopes with this capability.
On this page are a few demos of a graphics package which supports Variable Persistence Digital Phosphor, VPDP, an advanced display technique for bringing this capability to Windows applications. Emulation of phosphor fading is also supported.
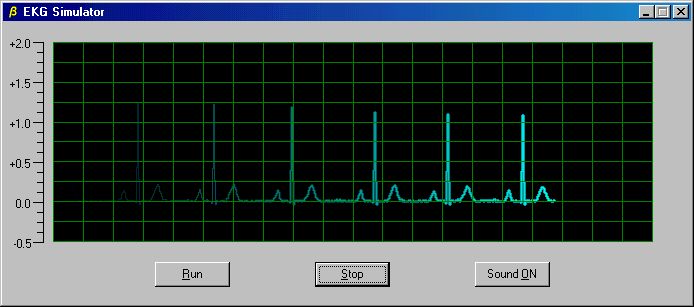
Screen Shot of EKG Simulator Using VPDP
The EKG simulator demo uses VPDP to provide a continuously updated display of a cardiac signal without the need to clear the screen between frames or clear the display during the progress of a frame. Click on the image to download the demo.
Ideal PR4 Signal Using VPDP
A running display of equalized partial response signals benefits from VPDP by allowing continuous updates without the need to clear the screen periodically. Since displayed signals fade with time, there is no problem with filling portions of the screen with solid color.
The signal shown is for a PR4 (Partial Response) Channel, without external noise. Noise can be easily added to demonstrate the closure of the 'eye' under increasingly noisy conditions. Click on the image to download the demo.
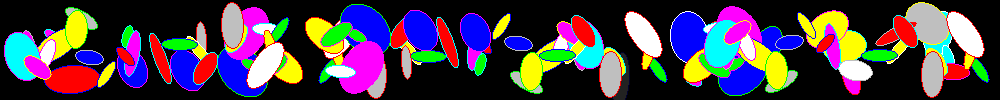
Density Plot of Step With Jitter Using VPDP
This demo uses a special palette to improve visualization of signal density. Not only are qualitative estimates of the jitter readily determined, but also the distributions of noise on the signal over time.
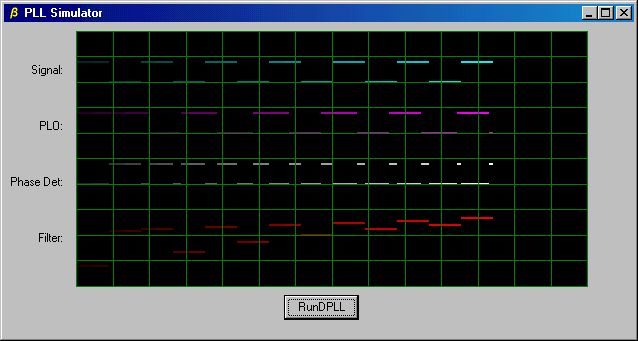
Screen Shot of PLL Simulator
This simulator is an application I use to examine the behavior of PLLs under differing conditions and using different parameters. Solid grids can be placed in front of or behind the signals. Note that multiple trace colors are supported. This file is a c++ version.
Here are some applications of VPDP technology applied to radar simulations.
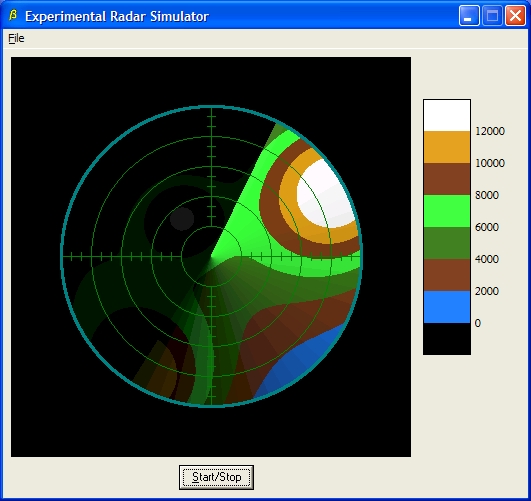
This simulator sweeps over a topographic surface displaying colors associated with the heights suggested by the accompanying legend. The reference location can be moved if desired, similar to the capabilities of an AWACS radar. Also, flying objects whose coordinates are known can be moved across the display. The sweep-and-fade action eliminates the need for erasing and redrawing objects or portions of the screen.
You can view the demo program that created this image and observe the sweeping action by downloading radar1.zip. The archive includes a special palette file which must reside in the same directory as the executable.
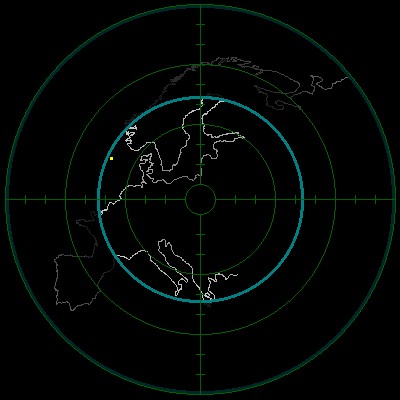
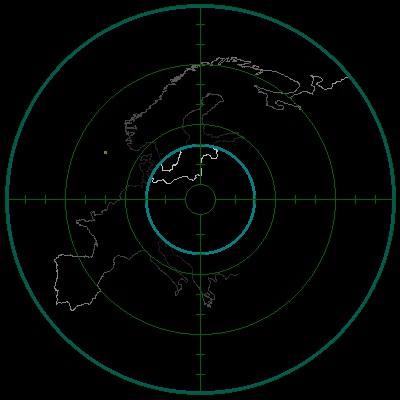
The display can also be implemented as an expanding circle centered at the transceiver location. The images below are taken from a radar simulation covering western Europe.
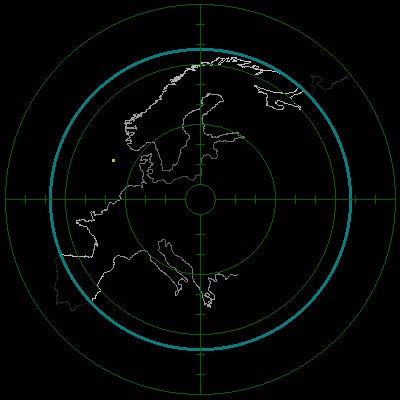
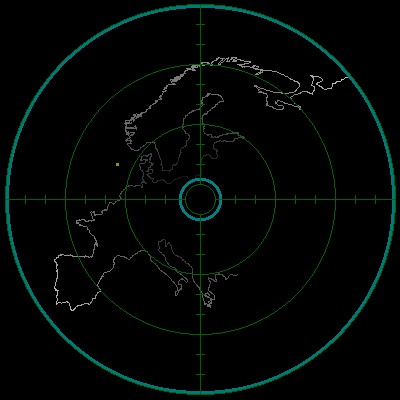
Note the presence of a moving object off the northwestern coast. The demo which produced these images allows the current display to be saved in a *.jpg file. It can be downloaded from radar2.zip. Also note that a special palette file and map-coordinate file are included in the archive and must be in the same directory as the executable.
CAUTION: This application uses the Intel Streaming SIMD Extensions (SSE,SSE2) but no checking or verification is done in the software. Your system will simply crash if it does not support these features.
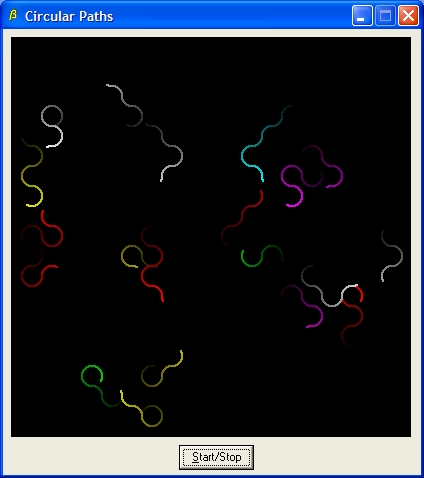
The screen shot below shows the display for a possible game or screensaver with sprites which have fading trails. This demo uses VPDP to control the length (persistence) of the tails of the various sprites as they wiggle around the screen..
Download ot worm.zip.
Game Playboard using VDPD
 /
/