This section contains a few applications which use methods described in previuos pages. Some of the items include demos of computer graphic methods and papers disclosing novel solutions to graphic problems. Source code is also included for some applications.
<\div>
Two dimensional curves are often derived from mathematical or geometric constructs and are only adapted for use in a computer graphics environment with difficulty. In the case of curves which are described by a parametric model, the usual plotting strategy consists of calculating discrete points on the curve and joining them with lines.
The strategy used here is to plot the parametric curve by driving the parameter monotonically from the start of the curve to its end using step sizes which result in pixel by pixel plotting. This method is so simple that it has certainly been discovered by others, although I have as yet found no references in the literature. A brief description follows, and an implementation fragment in C is discussed. I would be pleased to acknowledge prior art if anyone provides me with a reference.
Let the curve be specified by the following parametric form:
x = f(t),
y = g(t)
where x and y are the coordinates of a point on the curve.
Suppose at some point in the plotting process a particular pixel (x,y) has just been plotted. For the current value of t the values of x and y are the nearest integer values to f(t) and g(t), respectively. We now calculate dx/dt and dy/dt from the current t, f(t) and g(t). For many common curves, including conics, Bezier curves, B-splines, etc. this is straightforward. If no derivative function is available, finite differences can be used.
|dx/dt| and |dy/dt| are then compared to determine the direction of greatest motion. If the absolute value of dx/dt is greater, there will be a step in the x direction, otherwise the step will be in the y direction. Suppose the step is in the x direction. Then, since |dx/dt| =| f'(t)|, we have for dx = 1, dt = |1/f'(t)|. Thus, to update the parameter t, we simply set t=t+dt. The method is stable because the parameter is driven monotonically from start to end, and the steps are determined from the larger of the magnitudes of the derivatives in the x and y directions. These derivatives will never be zero at the same time.
t = 0.0;
while (t <= tmax) {
x = f(t);
y = g(t);
plot(floor(x+0.5),floor(y+0.5));
dx = fabs(fp(t));
dy = fabs(gp(t));
if (dx > dy) t += 1.0/dx;
else t += 1.0/dy;
}
The program fragment above shows the main loop for incremental scan conversion of the parametric curve. This algorithm is clearly far less efficient than the incremental algorithms used for lines and circles, but it is simple to implement and produces smooth curves. Note that fp refers to a function returning the derivative of f with respect to t, and gp returns the derivative of g.
A simple C++ program which generates an (x,y) point list for a tilted ellipse can be downloaded here. A complete Windows application which uses cubic splines to join user selected points and draws the curves with the above algorithm is also available. A technical paper describing the method in greater detail can be downloaded for further details..
This algorithm has much in common with differential equation solvers. One annoying similarity is that it will misbehave if the derivatives change rapidly in small regions. This corresponds to sharp corners on the curves where the calculated value of dx or dy is only valid over a distance smaller than a pixel. When this situation arises, there may be missing pixels in the plot. Further work is obviously needed to refine the algorithm so that it is robust in the face of pathological curves.
This algorithm was developed to solve the problem of incrementally plotting parametric curves. As such, it has very general scope. However, for specific curves such as circles and ellipses, a direct incremental plotting algorithm may be derived which does not require floating point operations and which will typically exhibit superior performance.
The next few paragraphs show some of the library features which do not appear elsewhere on this website. Other features, such as graphics primitives, general ellipse, variable persistence digital phosphor (VPDP) can be found by browsing.
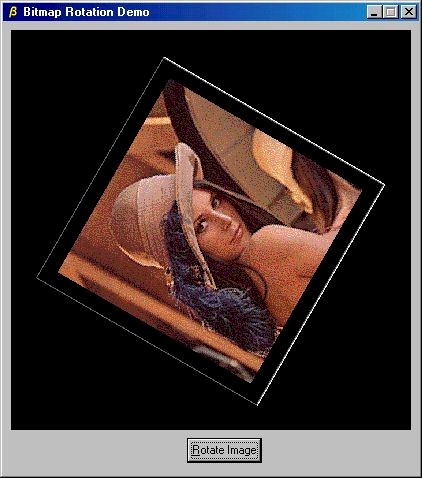
Screen Shot of Rotated Bitmap Image of "Lena"
Using assembler language, it is possible to implement an efficient algorithm for rotating bitmaps through arbitrary angles. A Windows application using such a method, shown above, is available here. This demo program rotates a 256-color bitmap through a full 360 degrees in 15 degree steps, displaying the bitmap at each step. The result is, in effect, an animation of a spinning bitmap. This application uses API calls to update the screen, but does not invoke any OpenGL, DirectX, hardware acceleration, or other high performance interface calls. No separate threads are used. NOTE: this is not an animation using multiple pre-computed images, but a real time image rotation and display demo. (The graininess of Lena's image is due to the reduction of the original color scale to 256 colors.)
A full featured contour plot capability is illustrated by the following screen shot.
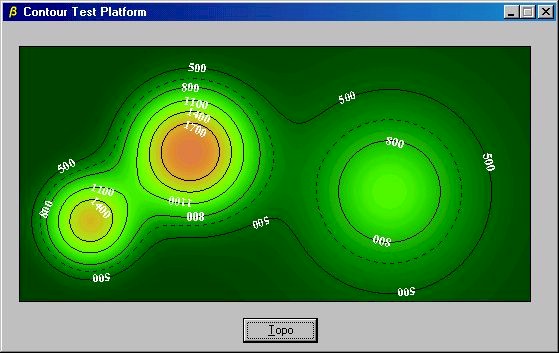
Screen Shot of Contoured Topographic Map
The graphics library supporting contour plotting and other features described elsewhere on this site is currently under development.